Team SPIMApes
Team members

Markéta Pernisová

Yong Wang

Olivier Burri

First official group photo
Local Guides

Christopher Schmied

Johannes Schindelin
Building our openSPIM
T configuration dual excitation (488, 561) microscope
Yong's Projects at the 2014 EMBO LSM Practical Course
Project A: Image Zebrafish Brain via Ptf1a-GFP
Pancreas transcription factor 1 subunit alpha (Ptf1a) is a protein that in humans is encoded by the PTF1A gene. This gene encodes a protein that is a component of the pancreas transcription factor 1 complex (PTF1) and is known to have a role in mammalian pancreatic development. Ptf1a is also shown to play an important role in the neurogenesis of different central nervous system structures. In particular, Ptf1a is important for the generation of many inhibitory (primarily γ-aminobutyric acid (GABA)-ergic) interneurons in different areas, such as the spinal cord and cerebellum. In this project, we imaged a transgenic zebrafish line expressing fluorescent Ptf1a-GFP fused proteins, with an emphasize on the structures in the brain.
Large FOV |
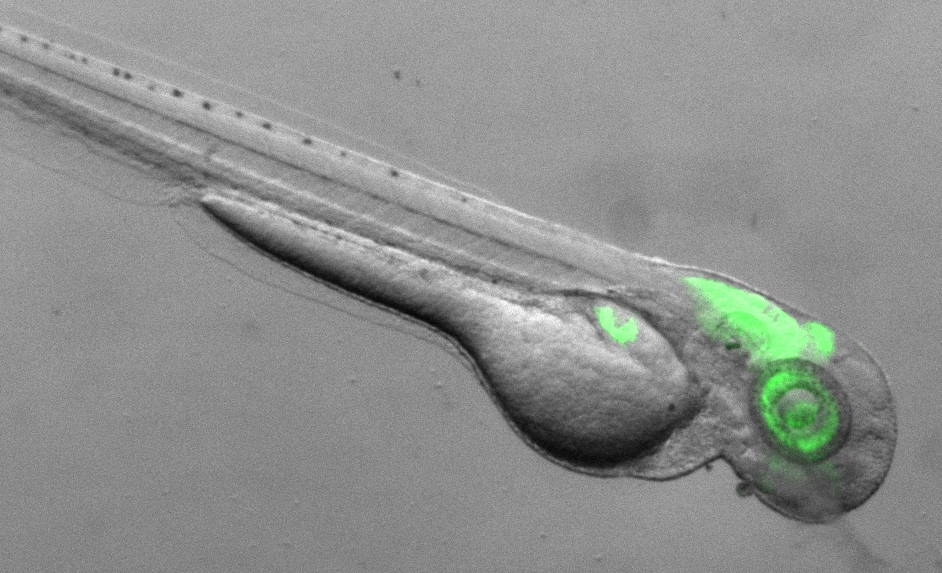
Small FOV |
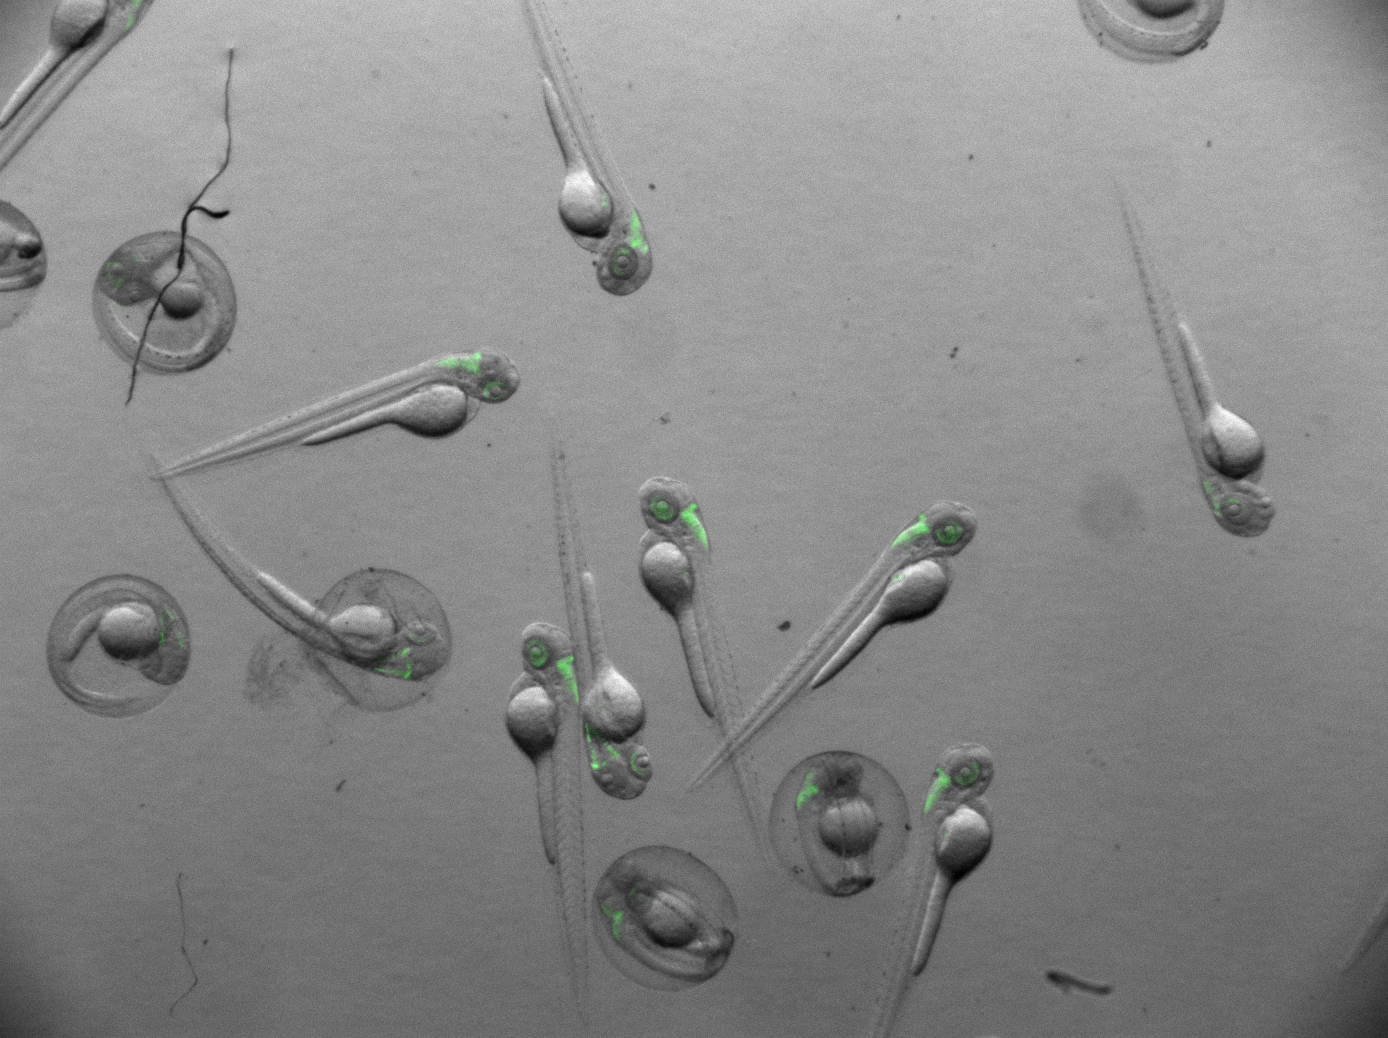
Overview of zebrafishes expressing Ptf1a-GFP.
Video showing heart-beating of live zebrafish sample
The major locations of cells expressing Ptf1a-GFP are at the regions of hindbrain, retina, and pancreas.
Imaging of a zebrafish expressing Ptf1a-GFP by Zeiss Lightsheet Z.1.
Reconstructed whole fish (stitching)
Zoom-in at the hindbrain (20X)
Zoom-in at one side of the hindbrain (50X)
Intensity map for estimating the expression level of Ptf1a-GFP in the hindbrain of zebrafish.
Hindbrain (20X)
Hindbrain (50X)
Multi-view Reconstruction (7 angles)
Multi-view
3D distribution of the expression level of Ptf1a-GFP in the head of zebrafish.
Intensity distribution
Timelapse of the hindbrain development (Huisken SPIM3)
View A
View B
View C
Project B: Image Zebrafish Brain via HuC-GFP
Imaging of a zebrafish expressing HuC-GFP by Zeiss Lightsheet Z.1.
Reconstructed whole fish
Head
Expression level
Marketa's Project
Task: In vivo realtime imaging of primordium development.
mDSLM
Objective: 40x/0.75W.
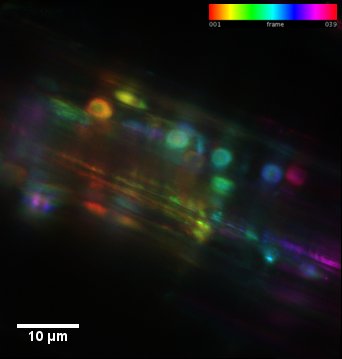
4 cells primordium. Color coding shows the depth.
Movie:
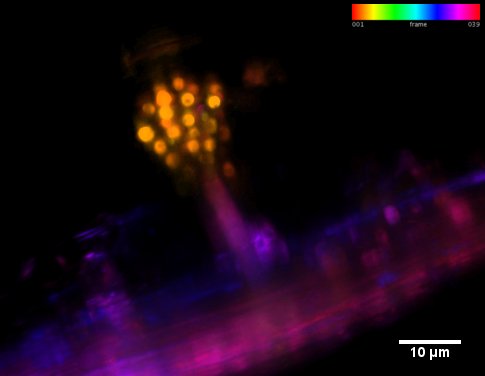
2 days old primordium. Color coding shows the depth.
Movie:
Expression level
Zeiss Lightsheet Z.1
Z projection of older primordium.
Emese's Project
Clearing and imaging primate cortical tissue
Clearing technique
For clearing the brains I used the DBE technique. It worked very well on the primate cortical tissue. I tried only this method.
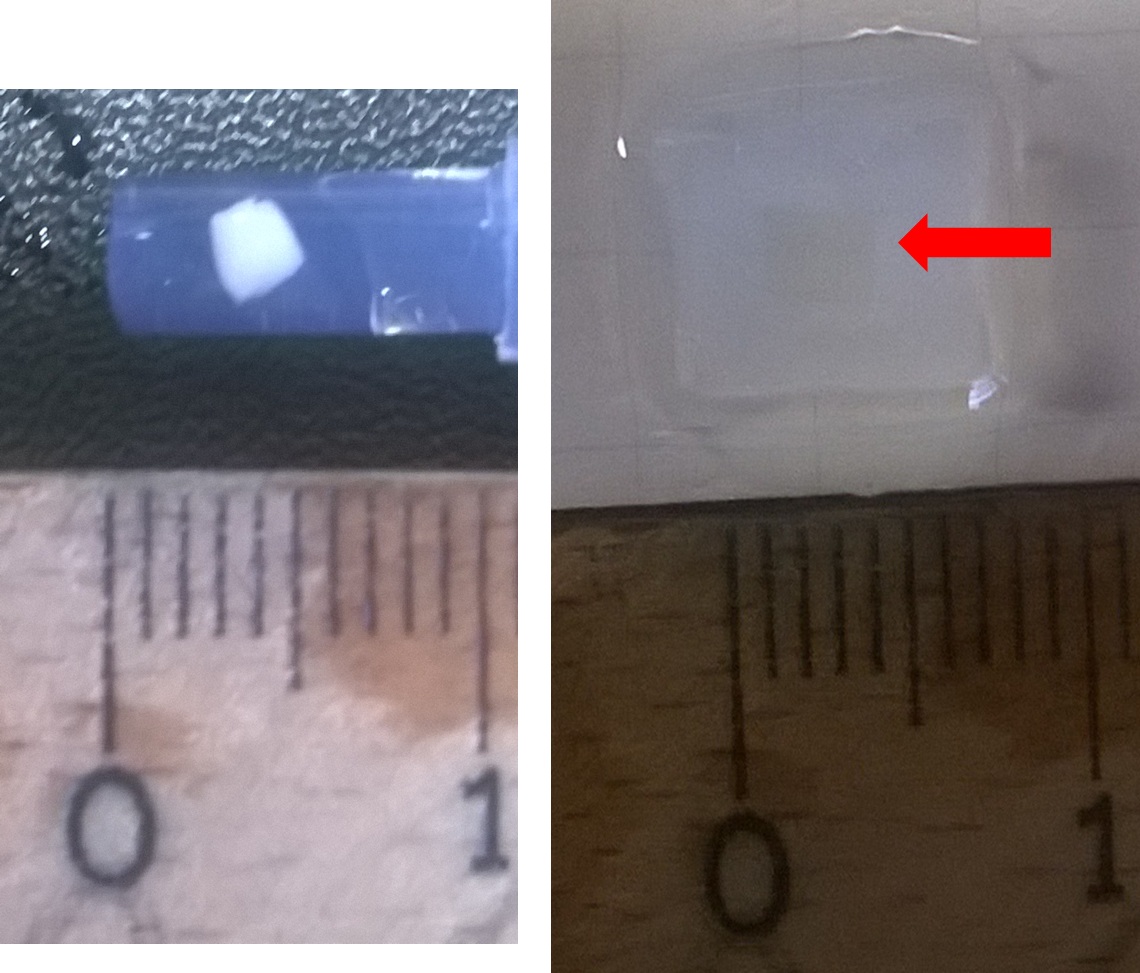
Uncleared and cleared (DBE) cortical tissue
Microscopes used in the course
On this microscope you allowed to image only uncleared tissue and the size of your sample is limited.
Question1: How deep can the lightsheet penetrate in the uncleared tissue?
Sample: Cortical tissue with somatostatin labeled interneurons, embedded in 1% agarose.
We used 20x objective and tried single and dual sided illumination too. The penetration of the lightsheet was around 60 um.
Uncleared and cleared (DBE) cortical tissue
Somatostatin labeled interneurons in the primate cortex. Single sided illumination. 20x
Somatostatin labeled interneurons in the primate cortex. Dual sided illumination. 20x
Question2: How deep can the antibodies penetrate? What can we achieve with thinner samples?
Sample: 100 um thick cortical tissue labeled with 3 interneuron markers, embedded in 1% agarose.
We used 20x objective and dual sided illumination. All of the antibodies penetrated through the sample. This is a nice way to investigate the presence and distribution of these interneurons in the cortex.
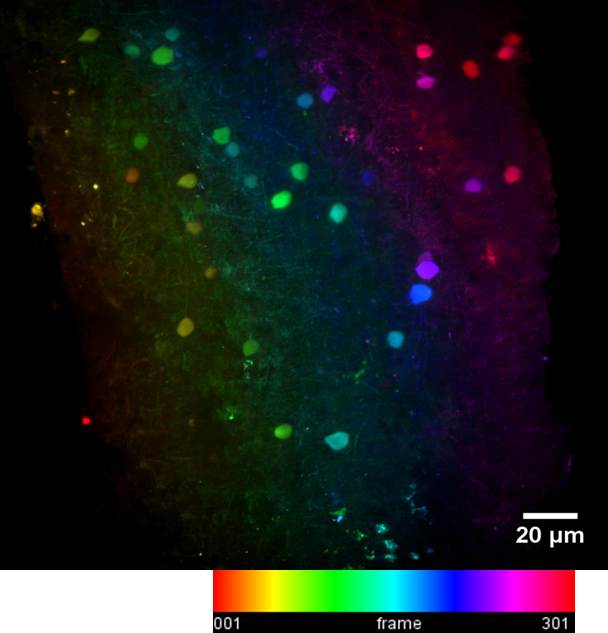
Parvalbumin labeled interneurons in the primate cortex. Color coding shows the depth. 20x

Parvalbumin (green), calretinin (purple) and somatostatin (blue) labeled interneurons in the primate cortex. 20x
This technique was developed for imaging big samples. The highest magnification we could get was 5x objective with 2x zoom.
Question: What can you see in the cleared tissue? Sample: DBE cleared cortical tissue. With this technique we imaged a big (2x2,5x1 mm) DBE cleared cortical tissue. We found only a few labeled cells. The poor staining may have caused by the antibody penetration or/and the clearing.
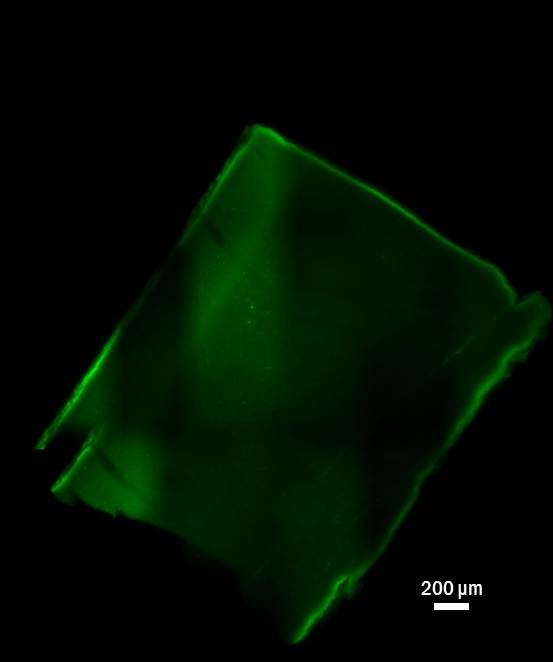
One overview plane of the cortical tissue. 10x
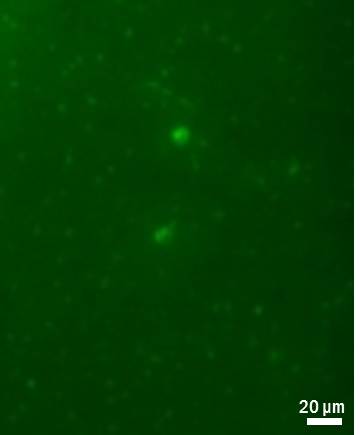
2 parvalbumin labeled cells. 10x